In our last blog on insulin sensitivity, we discussed briefly:
- What is insulin?
- Why is our sensitivity to this hormone important?
- What are some methods in which athletes or coaches routinely attempt to assess their management of blood glucose?
If you have not already read Part 1, stop here and go back and read it.
Assuming you are not a crazy person who enjoys reading blogs out of order, and you have read Part 1, Part 2 deals with actually assessing insulin sensitivity the best way we know how – at home! This is key, as there are other ways to directly assess insulin sensitivity if you have the money or a physician willing to do it for you. However, most people do not have this luxury and so, below, I outline for you some simple means for indirectly assessing insulin sensitivity and blood glucose management with minimal equipment and monetary/time commitment.
Oral Glucose Tolerance Test
This method is known as an oral glucose tolerance test (OGTT). It is in fact simple to conduct – in a fasted state (at least 6+ hours and ideally, after an overnight fast) and having not trained in the past 24 hours (exercise can skew the data), take a baseline measurement of your blood glucose levels and then drink a ~20 oz Gatorade (ideally aiming for about ~75 grams of glucose).
The important consideration here is that whatever you drink for your sugar source, that you can replicate which is why I suggest the 20 oz Gatorade as most people have quick access to this item.
Now, you will simply measure your blood glucose levels every 30 minutes for 2 hours. Ideally, you’ll remain inactive during these 2 hours, so go grab a book or your computer to get some work done. What these data points will give you is an area under the curve (AUC) and will reflect your baseline glucose before the drink, your peak blood glucose levels, and also how quickly they begin to return to baseline in that 2 hour window. See figure below for an idea of what those data points should look like.
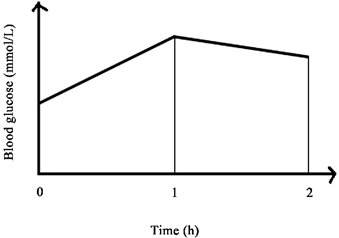
While the figure above only provides data points per hour, ideally you would have data points every 30 minutes for those 2 hours as it will help with your interpretations.

This is an ad. Please consider our shameless self promotion.
Data Interpretation
When analyzing your blood glucose responses to the OGTT, research has shown that a healthy and trained individual should peak their blood glucose within a 30-45 minute window (this is why 30 minute collection intervals are important (1)). From here, blood glucose should then begin returning to baseline. While it will unlikely return all the way to baseline within that 2 hour window, a good rule of thumb is that it should have decreased between 10-30% from your peak level.
Example: Baseline: 80 mg/dL→+30 min: 140 mg/dL → +60 min: 130 mg/dL →+90 min: 115 mg/dL → +120 min: 110 mg/dL
As you can see from the fake data above, the peak occurred at ~30 min mark (140 mg/dL) and this person experienced about a ~20% decrease from their peak (2 hours post: 110 mg/dL). If you find that your blood glucose peaks after the 60 min mark or that there is a delayed response in your post-peak return to baseline, these could be indicators that there is some insulin resistance occurring (2). While you cannot use this blog as a medical diagnosis, you can use it as a general idea of maybe some areas to improve upon in your training, nutrition, sleep, or other lifestyle habits (see Blog Part 3). Following corrections, you could then re-test every 4-6 months and compare similar data points to see if there are improvements occurring.
While the OGTT is one at-home method that allows you a rough idea of your insulin responses to a glucose loaded beverage, there are a few others that can offer additional insight when paired with your OGTT data.
Additional Measures
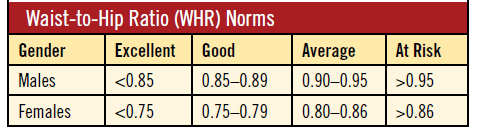
Waist:Hip Ratio (W:H) – W:H ratio is quite simple. Simply measure your waist (at the belly button) and then your hips (around the “peak” of where your glutes stand out) in centimeters and then divide (W/H). This ratio provides the user an idea of exactly how much fat they carry around important organs and it correlates well with insulin sensitivity (3). As I mentioned earlier, people that are insulin sensitive are generally lean and walk around with an optimal body fat level for their build. What makes the W:H ratio ideal is that you only require a tape measure to get these values and ratio.
BodyFat % – Lastly, it is always good to know your overall body fat %. Simple and easy to collect, body fat is a great predictor of your overall metabolic health. Again, it is not common to find someone walking around with an optimal body fat level and some form of insulin resistance unless an underlying metabolic disturbance is occurring (e.g., type 1 diabetes or PCOS). My suggestion: have someone trained in skinfolds from your local gym, health store, or college collect and provide you with this data. Avoid bioelectrical impedance analysis (BIA) which runs an electrical current through you to predict your body fat, as these are subject to large variance and error due to a multitude of factors that you need to control for – like hydration status or even phase of the menstrual cycle.

Conclusion
Using an OGTT, W:H ratio, and your overall body fat %, anyone can get a fairly accurate assessment of how well they are managing their blood glucose levels and overall insulin sensitivity. Better yet, these measures are accurate, effective, and minimal cost collection tools that can be repeated at home. By recording these data points and repeating them over time, they provide easy methods for measuring improvements to your metabolic health (like recording and measuring your squat before and after a squat cycle). Remember – this series of blogs (Parts 1-3) are simply to assist the individual in improving their metabolic health and performance. These blogs are not medical advice nor intended to replace a physician’s recommendations. That said, what if you find that there may be some indication (based on our criteria above) of insulin resistance occurring? Or maybe even some of the other indirect markers need improving such as body fat, W:H ratio, etc? In Part 3, I provide some areas to focus on that will make significant improvements in these areas and get you on the right track to taking back your health and empowering your performance.
Can’t wait for Part 3 to get started? Check out our Training Programs and we’ll help you get any extra body fat in check.
References:
1. Wang X, Zhao X, Zhou R, Gu Y, Zhu X, Tang Z, Yuan X, Chen W, Zhang R, Qian C, Cui S. Delay in glucose peak time during the oral glucose tolerance test as an indicator of insulin resistance and insulin secretion in type 2 diabetes patients. J Diabetes Investig. 2018 Nov;9(6):1288-1295. doi: 10.1111/jdi.12834. Epub 2018 Apr 20. PMID: 29537733; PMCID: PMC6215929.
2. Chung ST, Ha J, Onuzuruike AU, Kasturi K, Galvan-De La Cruz M, Bingham BA, Baker RL, Utumatwishima JN, Mabundo LS, Ricks M, Sherman AS, Sumner AE. Time to glucose peak during an oral glucose tolerance test identifies prediabetes risk. Clin Endocrinol (Oxf). 2017 Nov;87(5):484-491. doi: 10.1111/cen.13416. Epub 2017 Aug 6. PMID: 28681942; PMCID: PMC5658251.
3. Wahrenberg H, Hertel K, Leijonhufvud BM, Persson LG, Toft E, Arner P. Use of waist circumference to predict insulin resistance: retrospective study. BMJ. 2005 Jun 11;330(7504):1363-4. doi: 10.1136/bmj.38429.473310.AE. Epub 2005 Apr 15. PMID: 15833749; PMCID: PMC558285.
RELATED CONTENT:
BLOG: A COACH’S FIELD GUIDE TO HORMONES
PODCAST: EP 726 – WELLCORE’S DIABETES BATTLE AND HORMONE INSIGHTS
EDU: POWER ATHLETE METHODOLOGY

Tagged: Hormones / Insulin / Nutrition / Nutrition Coaching / Performance
AUTHOR

Hunter Waldman
Hunter Waldman is a former DII collegiate linebacker who found his passion in Nutrition and Exercise Physiology during his undergraduate years. After working as a Strength and Conditioning coach/personal trainer for several years, Hunter pursued his doctorate in Exercise Physiology while also serving as a Sweat Scientist for the Gatorade Sport Science Institute (GSSI) in Florida. Hunter is now a Professor of Exercise Science at the University of North Alabama, Researcher, Director of the Exercise Biochemistry Laboratory, and Power Athlete Block-1 Coach. Hunter's research area is in Nutrition and Metabolic Health/Performance, where his lab is attempting to understand how to increase cell stress resiliency via nutrition, supplements, and exercise.
RECOMMENDED READING


SUBSCRIBE TO OUR NEWSLETTER
Never miss out on an epic blog post or podcast, drop your email below and we’ll stay in-touch.